
 Open Access
 Abstract
This study aimed to assess the spatial and temporal variations in surface water quality in Binh Thuan Province and identify the underlying causes of pollution affecting regional water resources. The comprehensive assessment was based on surface water monitoring data systematically collected from 2016 to 2019, totaling 24 strategically positioned monitoring sites distributed across three distinct areas: 12 sites in upstream domestic water supply areas, 4 sites in downstream domestic water supply areas, and 8 sites in downstream non-domestic water supply areas. Water quality parameters were monitored quarterly throughout the study period, with sampling conducted twice during the rainy season and twice during the dry season to capture seasonal fluctuations. A total of 14 water quality parameters were collected at each monitoring event and rigorously compared against national water quality standards established by the Ministry of Natural Resources and Environment. The entire dataset was subjected to sophisticated statistical analysis employing multiple analytical approaches, including Principal Component Analysis and Factor Analysis (PCA/FA), two-way Analysis of Variance (ANOVA), and Water Quality Index (WQI) calculations. Statistical results from PCA/FA successfully identified five principal factors that significantly influence surface water quality conditions: domestic wastewater discharge, industrial activities, agricultural activities, saltwater intrusion, and meteorological conditions, collectively accounting for 54.52% of the total variance in the dataset. ANOVA analysis revealed that surface water quality in Binh Thuan Province exhibited distinct spatial and temporal variations throughout the monitoring period. WQI calculations demonstrated that water quality systematically declined from upstream to downstream areas and was consistently superior during the rainy season compared to the dry season. The comprehensive findings contribute significantly to elucidating the complex impacts and characteristics of socio-economic development activities on surface water quality in Binh Thuan Province, thereby providing valuable scientific evidence to assist provincial authorities in developing effective water resource protection strategies to support sustainable socio-economic development objectives.
Introduction
Surface water systems provide water for industrial, agricultural, service, and domestic purposes while also functioning as receptors and diluters of wastewater 1 . This resource is also very important for annual socio-economic development policy 2 , 3 . Due to the rising pressure from socio-economic development and climate changes, both the quantity and quality of water in rivers, lakes, and canals need to be preserved 2 , 4 .
Generally, water pollution arises from various anthropogenic and natural sources 5 . Human pollution typically originates from industrial and agricultural operations, domestic activities, and wastewater discharge 6 . Natural contamination include climate changes (precipitation, humidity, and evaporation) and calamities (drought, floods, and landslides) 7 . Water resources located in coastal areas can be especially impacted by both factors 8 . Wastewater from agricultural, industrial, and residential areas has been identified as an important source of pollution that degrades surface water quality in many regions 9 , 10 . Wastewater flows generated from agriculture, aquaculture, industry, and residential zones is a major factor in declining water quality in the surface water systems 11 . Seasonal changes further influence water quality through variations in hydrological conditions.These indicate that surface water quality may fluctuate spatially and temporally, which requires further research. Furthermore, the major sources of surface water pollution must be evaluated to develop appropriate management strategies and effective treatment solutions 12 . Statistical analysis methods such as PCA, FA, and ANOVA have been widely used in studies on surface water quality and in identifying sources of pollution 1 , 13 , 14 15 , 16 , 17 , 18 , 19 , 20 , 21 .These findings indicate that multiple pollution sources may contribute to the degradation of surface water quality, which need to be analyzed and assessed for better management.
Binh Thuan is a coastal province in the South Central Coast of Vietnam, with a geographical transition from the south to the west (forming the country's remaining 'S' shape). The region experiences a prolonged dry season, often lasting up to nine months of the year. Its rivers are typically short with highly variable flow rate in rainy season. During the rainy season, the flow rate may be very high. Recently, the rapid socio-economic development of Binh Thuan province has generated a large amount of untreated wastewater discharged into water sources, which degrades water quality. Many human factors, such as industrial production, aquaculture, agricultural production, residential activities, and natural factors (water runoff and seawater intrusion) can pollute surface water sources in the province 22 . Pollution distribution varies by location. Regarding spatial distribution, downstream (coastal) areas can be significantly affected by seawater intrusion and anthropogenic sources such as industrial, agro-aquaculture, and residential activities. Moreover, midstream and upstream areas are affected by several pollution sources, such as agricultural, aquaculture, and residential activities. Seasonal variations further complicate pollution dynamics. Thus, this study aims to investigate spatial and temporal variations in surface water quality and identify the primary sources of pollution in Binh Thuan Province. The study hypothesizes that surface water quality in the study area varies significantly based on spatial factors (the specific regions within the study area) and temporal factors (seasons).
MATERIALS AND METHODS
Study area
This study was conducted in Binh Thua province, located at 10 o 33'42" to 11 o 33'18" N and 107 o 23'41" to 108 o 52'18" E. The province has a coastline of 192 km and covers an area of approximately 7,812.8 km². Its population is estimated at 1.201.239 individuals (according to official statistics as of April 1, 2019), and a density of 153 people/km 2 . It consists of 10 administrative units (including 8 districts, 1 town, 1 provincial city) and 127 communes, wards and towns 22 .
The region features low to medium-height hills and narrow coastal plains, with topography sloping from northeast to southwest. Four main land types were identified: medium-height mountains (31.65%), low hills (40.7%), tidal flats (9.43%), and coastal sand dunes (18.22%). Binh Thuan is located in a sub-equatorial tropical monsoon climate zone that is characterized by abundant sunlight, strong winds, and no distinct winter season. As one of the driest regions in the country, these harsh conditions pose challenges to daily life but also offer favorable potential for wind power development. The climate in Binh Thuan can be distinctly categorized into two seasons: the rainy and dry season. The average annual temperature ranges from 27-29°C, with total yearly sunshine hours ranging from 2,900 to 3,000 hours. Total annually rainfall is from 800 to 1,600mm, increasing in intensity towards the south.The rainy season is from May to October, while the dry season extends from November to April of the following year. However, it's important to note that the rainy season is concentrated primarily in August, September, and October. Consequently, the dry season is often more prolonged. Rivers in the region are short and seasonal. Their flow varies significantly between the rainy and dry seasons, necessitating the use of reservoirs for water management. Therefore, the construction of irrigation systems, afforestation for soil coverage, and windbreaks play a crucial role in the province's development 22 .
The surface water system in the province comprises 65 rivers and canals, with a total area of 5.000km 2 . It consists of the 7 main rivers, La Nga, Long Song, Luy, Cai Phan Thiet, Ca Ty, Phan and Dinh. Five rivers discharge into the sea, primarily at Phan Thiet Estuary, Phan Ri Estuary, and La Gi Estuary. This study area's total annual water volume is approximately 2.393 million cubic meters. This water is extracted, utilized, and transferred between this basin through the presence of 48 large, medium, and small reservoirs. The three most significant reservoirs are Song Quao Reservoir in Ham Thuan Bac district (V h =80 million m 3 ), Ca Giay Reservoir in Bac Binh district (V h =37 million m 3 ), and Long Song Reservoir in Tuy Phong district (V h =37 million m 3 ) 22 .
In general, the surface water system in Binh Thuan province is influenced by natural factors (such as topographical slope, savanna climate, water evaporation, precipitation, erosion, and saltwater intrusion), and human factors (economic, social, and human activities), the type of water sources (rivers, lakes, canals). Anthropogenic and natural factors have different impacts on surface water quality in the study area, depending on the origin and characteristics of the pollution sources, the flow and pollutant load, as well as the effectiveness of pollution control and treatment solutions implemented before discharge into receiving water bodies.
Experimental set-up
Surface water samples were collected at 24 monitoring sites ( Figure 1 ) categorized into three zones: TN-SH (upstream domestic water supply), HN-SH (downstream domestic water supply), and HN-KSH (downstream non-potable water supply). The zones represent different levels of human and natural impact.
Figure 1 . Map of the study area and sampling site in Binh Thuanprovince, Vietnam. NM1 to NM24 are denoted for sampling sites
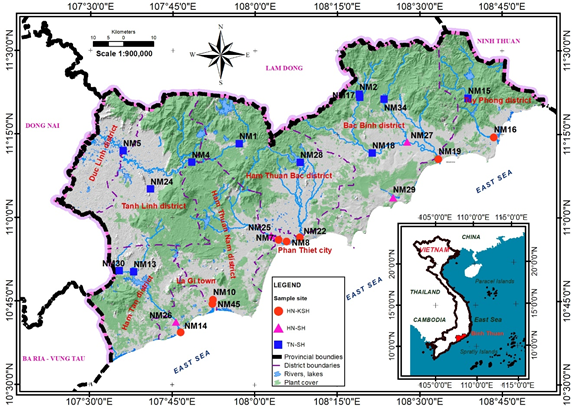
The study is conducted based on the application of statistical analyses (PCA, FA and ANOVA) to process monitoring data, with the aim of clarifying the spatial and temporal variations in surface water quality in Binh Thuan province and identifying pollution sources. The research specifically examines the impact on surface water quality of two completely randomized and repeated experimental factors: temporal factors (dry season, rainy season) and spatial factors (3 zones of surface water distribution system from upstream to downstream: TN-SH, HN-SH, and HN-KSH) ( Figure 1 ).
Based on the surface water system and 24 monitoring points for surface water quality, 3 surface water regions were selected for study. These include TN-SH, representing the upstream water supply sources (12 monitoring points), which is heavily influenced by natural factors; HN-SH, representing the downstream water supply sources (4 monitoring points), which is strongly impacted by anthropogenic factors; and HN-KSH, representing the downstream of non-portable water supply system (8 monitoring points), which affected simultaneously by human activities and saline intrusion. The criteria for selecting the monitoring locations were as follows: (1) Objectives satisfaction: Protecting surface water environments according to the province's environmental strategy/goals (effective and sustainable use of surface water resources; monitoring and protecting water quality); (2) Functional assurance: The selected locations must be highly representative of the environmental quality in a given area and serve as strong indicators of pollution sources, facilitating the identification of causes for changes in water quality; (3) Technical requirements: Locations should allow for integration/modeling and forecasting; (4) Other considerations: Relative stability of natural conditions (geography, climate, hydrology, etc.) and accessibility. The temporal factor was analyzed in terms of the rainy and dry seasons, with a dataset of surface water monitoring accumulated over 4 years (2016–2019). Monitoring was conducted at each site with a frequency of 4 times per year during the dry season (March, December) and the rainy season (June, September). A total of 384 samples (24 sites x 4 times/year x 4 years) were collected.
Water sampling and analysis
A Van Dorn water sampler was used to collect water samples, which were taken in the 0–50 cm surface layer. 5L plastic containers with firm caps contained the samples, which were immediately stored in an icebox at 4 o C and transported to a laboratory for measurements Table 1 .
The water remaining in the Van Dorn container was measured directly for pH by Thermo Scientific™ Orion™ 3-Star Benchtop pH Meter, turbidity by a portable turbidity meter NTU 100, temperature by °C Meter, electrical conductivity (EC) by Oaklon conductivity,Con 11 series, and dissolved oxygen (DO) using an Oxygen 3210 portable dissolved oxygen meter.
The laboratory analysis covered nine additional parameters: Cl − , NH 4 + , NO 2 - , NO 3 - , total suspended solids (TSS), PO 4 3− , five-day biochemical oxygen demand (BOD 5 ), chemical oxygen demand (COD), and total coliform Table 1 . All methods followed the national technical regulation QCVN 08:2023/BTNMT 23 . All parameters are expressed in mg/L, except for the total coliform parameter, which is measured using MPN/100mL.
Statistical analysis
The JMP Pro 13 (SAS Institute Inc., NC, USA) was used for statistical analyses. Sigmaplot 12 software (Systat Software Inc) was applied to create all figures.. The statistical analysis process in this study consists of 5 sequential steps as follows: (1) Descriptive statistics: calculation of the means and standard deviations of 14 water quality parameters at 3 spatial locations (TN-SH, HN-SH, and HN-KSH) and comparison with QCVN 08:2023/BTNMT—the national technical regulation on surface water quality. This includes categorizing water quality levels, with Column A classification for areas used for domestic water supply (TN-SH, HN-SH) and Column B classification for areas intended for other uses (non-portable water) 23 . (2) Pearson correlation analysis examines the relationships among the 14 water quality parameters through Pearson correlation analysis. (3) Source identification of pollution: Differentiating pollution sources by employing principal component analysis and factor analysis (PCA and FA) on the complete dataset. (4) Two-way analysis of variance (ANOVA): application of ANOVA to compare the water quality parameters across the three spatial locations (TN-SH, HN-SH, and HN-KSH) during two seasons (rainy and dry). (5) Water quality index (WQI) calculation: The calculation of the water quality index (WQI) follows the guidelines of the Vietnam Environmental Administration (2019). The WQI indices will also involve ANOVA to assess variations based on spatial location and seasonal factors. Pearson correlation analysis is a preliminary descriptive technique used to estimate the degree of association between multiple variables involved in the study. The following formula is employed to calculate the Pearson correlation coefficient (1):
where r is the Pearson correlation coefficient between variable X and variable 𝑌 ; n is the number of observations; X i the value of X of i-th observation; Y i the value of Y of i-th observation.
The values of 𝑟 range from −1 to 1, with the sign of each correlation coefficient indicating a negative (-) or positive (+) relationship between the variables. A strong correlation is indicated when the coefficient 𝑟 approaches −1 or 1. A moderate correlation is observed when its absolute value falls between |0.3| and |0.5|; correlation coefficients greater than 0.5 are considered strong. Conversely, the correlation is deemed low when the absolute value of the correlation coefficient is less than |0.3| 24 , 25 .
Principal component analysis and factor analysis (PCA and FA) is utilized to categorize the pollution sources that may contribute to water quality degradation. PCA facilitates the reduction of base parameters that do not significantly contribute to data variability while generating a new set of parameters known as principal components (PC). The eigenvalue coefficient is used to determine which principal components (PCs) are selected (Eigenvalue >=1). The larger this coefficient, the more significant its contribution to explaining the variability of the original dataset 26 . Factor analysis (FA) further reduces the contribution of less significant variables obtained from PCA, resulting in new variable groups known as varimax factors (VF), which are generated by rotating the axes of the principal components (PCs) identified by PCA 16 .
A two-way analysis of variance (ANOVA) was conducted based on a completely randomized design, incorporating two experimental factors, including spatial location. (TN-SH, HN-SH, and HN-KSH) and season (rainy season and dry season).. The statistical model for the ANOVA is: γ ije = μ + β i + α j + αβ ij + ε ije ; where γ ije is the response of individual combinations of two experimental factors; μ is the overall mean of the whole dataset; β i is the effect of the i th spatial zone; α j is the effect of the j th ; αβ ij is the interaction effect between spatial zone and season and ε ije is the random error with a mean zero and normal distribution 27 . Following a significant ANOVA result (P ≤ 0.05), Tukey’s Honestly Significant Difference (HSD) test was employed to distinguish differences among treatment means.
The parameters used to calculate the Water Quality Index (WQI) according to the guidelines of the Vietnam Environmental Administration in 2019 are divided into five groups: the pH group, the pesticide group (comprising 9 parameters), the heavy metal group (comprising 7 parameters), the organic and nutrient group (comprising 8 parameters), and the microbiological group (comprising 2 parameters). These parameters must satisfy two conditions: (1) at least 3 out of the 5 parameter groups must be included in the calculations, and (2) the organic and nutrient group must contain at least 3 parameters. Thus, the dataset in this study fulfills the requirements for calculating the WQI. Meanwhile, according to the guidelines of the Vietnam Environmental Administration, parameters such as turbidity, electrical conductivity, total suspended solids (TSS), and chloride (Cl−) have not been calculated; thus, the dataset used for calculations includes only 10 out of the 14 analyzed parameters.
WQI value is calculated by the formula (2):
where WQI a refers to the WQI value calculated for the parameters DO, BOD 5 , COD, N-NH 4 + , N-NO 2 − , N-NO 3 − , and P-PO 4 3− ; WQI b is the WQI value calculated for coliforms, while WQI pH represents the value calculated for pH. The calculated WQI is subsequently analyzed using ANOVA based on the spatial and seasonal factors.
RESULTS & DISCUSSION
Descriptive statistics
The result of statistical analysis of water quality monitoring data in Binh Thuan for 4 years (2016-2019) are shown in Table 1 . The surface water system has been affected by anthropogenic pollution sources and natural factors. In the TN-SH and HN-SH zones, concentrations of TSS, BOD₅, COD, and Cl⁻ (HN-SH), along with Coliform counts, surpassed QCVN 08:2023/BTNMT Level A thresholds. In the HN-KSH zone, levels of BOD₅, COD, Cl⁻, NO₂⁻, and Coliform were recorded, exceeding Level B limits.
Correlation among Water Quality Variables and the result of multivariate analysis (PCA and FA)
Table 2 present the correlation between 14 observed indicators in the study area. It can be found that most of the 14 water quality parameters have a significant correlation with p ≤ 0.05 ( Table 2 ). The correlations between two parameters with a meaningful relationship are in bold numbers. Some medium-strong positive correlations are: TSS-turbidity (0,43); COD-BOD (0,6); Cl - - Conductivity (0,34), Cl - - COD (0,41). Therefore, the relationships among the water quality indicators and the parameters contribute to determining the characteristics of study water bodies.
PCA and FA grouped variables into five principal components that together accounted for 54.52% of the total variance ( Table 3 ). The main factors (PC 1) included BOD₅, COD, EC, and Cl⁻, which accounted for 16,98% of the total variance, had a high load value (>0.5). The second factor (PC 2) comprised turbidity, TSS, and NO₂⁻, and accounted for 12,95% of the total variance . Similarly, the third principal component (PC3) grouped Coliform and NH₄⁺, accounting for 8.79% of the total variance in the dataset. The fourth component (PC4) showed substantial loadings for NO₃⁻ and PO₄³⁻, while the fifth component (PC5) demonstrated strong correlations with temperature, pH, and dissolved oxygen (DO). Together, PC4 and PC5 explained 8.16% and 7.64% of the total variance, respectively.
The sources of surface water pollution in Binh Thuan province
Five principal components extracted from PCA and FA analysis ( Table 3 ) identified several major pollution sources that significantly impact 14 surface water quality parameters in the study areas. In relation to Factor 1, the most critical pollution sources affecting BOD₅ and COD are likely to originate from agricultural activities, aquaculture, industrial discharges, and domestic wastewater.
The primary causes of BOD₅ and COD pollution are anthropogenic activities such as wastewater from agriculture, aquaculture, industry, and households. BOD₅ and COD are closely related and are typically formed from various wastewater sources 28 , 29 . Agricultural practices using organic fertilizers 30 introduce a large amount of organic matter into the environment. Aquaculture wastewater contains high levels of nutrients, organic matter, and animal waste 31 . Similarly, industrial and domestic wastewater contribute significant nutrient and organic loads to surface water bodies 32 .
In inland aquatic systems, salinity is reflected through parameters such as Cl⁻, TDS, or EC 33 . Saltwater intrusion is the main cause of increased EC and Cl⁻ concentrations, and salinity in surface waters of river basins 17 , 20 , 34 . This degrades water quality and affects the livelihoods and production of local communities, especially in coastal estuaries and southern floodplains such as the Dong Nai River Basin and the Mekong Delta 35 . Currently, saltwater intrusion is becoming more prevalent in estuarine and coastal plain areas 35 , 36 . In Binh Thuan Province, saltwater intrusion is increasingly severe due to climate change impacts—particularly in estuaries such as Dinh, Luy, Phan, Ca Ty, and Cai rivers—where saline intrusion reaches far inland, and Cl⁻ concentrations significantly exceed the limits set in Column B of QCVN 08:2023/BTNMT 23 .
Similarly, saltwater intrusion in estuarine areas may also be the key factor affecting Coliform (which has a high loading on Factor 3) and pH (high loading on Factor 5) values in the water ( Table 3 ). Saltwater intrusion increases Cl⁻ concentrations, raises pH levels, and reduces the number of coliforms detected in water, thereby weakening the self-purification capacity of rivers and canals 37 .
Turbidity (NTU) and Total Suspended Solids (TSS) have high loadings on Factor 2 ( Table 3 ). These parameters may indicate soil erosion or wastewater inflows from residential, industrial, agricultural, or aquaculture sources 16 , 21 , 38 , 39 . Suspended solids are abundant in domestic and aquaculture wastewater and can pollute surface waters 28 , 31 . Leftover feed, excrement, and metabolic waste from aquaculture activities release high levels of suspended solids into the water 40 . Shrimp farming—a dominant aquaculture activity in Binh Thuan—results in persistently high TSS levels 8 , and shrimp is one of the key species cultivated in the province’s major aquaculture areas 22 .
Parameters such as NO₂⁻ (high loading on Factor 2), NH₄⁺ (Factor 3), NO₃⁻, PO₄³⁻ (Factor 4), and DO (Factor 5) ( Table 3 ) may all be associated with pollution from agricultural, forestry, aquaculture, and domestic sources. Nutrient-rich surface waters are indicative of areas influenced by agricultural runoff 41 . Domestic wastewater contains high levels of phosphorus compounds 42 . Livestock and aquaculture wastewater are also rich in nutrients and organic matter 32 . NH₄⁺ and PO₄³⁻ represent nutrient pollution from aquaculture and domestic wastewater 31 , 43 , 44 . A study by Wilbers [8] also found that untreated wastewater is a major source of nutrients in surface waters in the Mekong Delta.
As for water temperature (Factor 5), the rise in temperature may be attributed to prolonged sunny conditions in Binh Thuan. The province experiences a long dry season of up to nine months, with intense solar radiation and total annual sunshine hours reaching 3,000 (averaging 250 hours/month) 22 , leading to increased water temperature and evaporation. Furthermore, suspended solids in water can absorb heat from sunlight, further raising the water temperature and evaporation rate 45 .
In general, based on the multivariate analysis results (PCA and FA), it can be concluded that under current conditions in Binh Thuan Province, the main sources of surface water pollution include domestic wastewater, industrial discharges, agricultural runoff, and natural factors such as saltwater intrusion and prolonged heat.
Water quality parameters trends
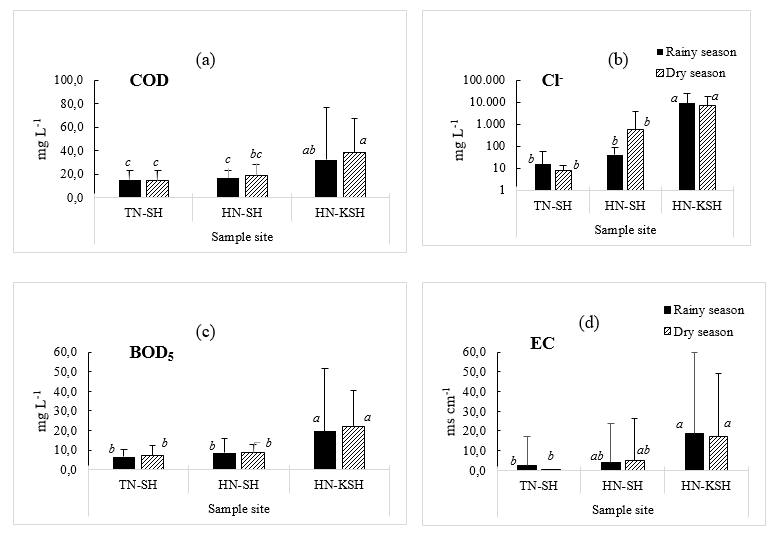
As Table 3 , the BOD 5 and COD (having a high loading value with PC 1) were significantly affected by seasonal variation and spatial zone ( Figure 2 ). BOD 5 and COD levels increase gradually from the upstream to the downstream sections in areas designated for domestic water supply (QCVN 08:2023/BTNMT, Column A) to those intended for non-portable water supply (QCVN 08:2023/BTNMT, Columns B, C, D). Additionally, these levels are higher in the dry season than in the rainy season. This indicates that the pollution level in rivers rises as water flows from upstream to downstream (especially organic and nutrient pollutants,) leading to higher BOD 5 and COD values in surface water. During the rainy season, rainfall dilutes organic and nutrient pollutants in the river, lowering BOD 5 and COD levels compared to the dry season. Some previous studies proposed that the transport of contaminants from upstream or from adjacent areas toward downstream regions can cause the reduction of water quality 46 , 47 .
Figure 2 . Seasonal variation of water quality parameters in factor 1(a, b, c, d), including: COD, Cl - , BOD 5 , EC (Note:Error bars indicate the standard deviation of the mean. Within the insets, barswith the different letter are significantly different from each other (p<0,05)). TN-SH - the upstream of the domestic water supply source; HN-SH -the downstream of the domestic water supply source, and HN-KSH - the downstream of the non-potablewater supply source.
Source: Author
Likewise, the interaction between seasonal dynamics and spatial heterogeneity had a significant influence on electrical conductivity (EC) and chloride (Cl⁻) levels. The increase of EC and Cl - from upstream to downstream showed the strong impact of saline intrusion on water quality in Binh Thuan. There was a variation of seasonal impact on study areas. In the TN-SH zone, the dry season had a lower EC and Cl - than the rainy season. Erosion during the rainy season can be the reason for this issue. It also increases the Cl - level in water bodies 48 . In the HN-SH zone, the dry season had a higher magnitude of the EC, Cl - concentration than the rainy season. The saltwater intrusion into the inland area may be the reason for this situation. Meanwhile, in the downstream area of the estuary, these parameters were less affected by the interaction of seasonal variation because this zone is often strongly influenced by saline intrusion 22 .
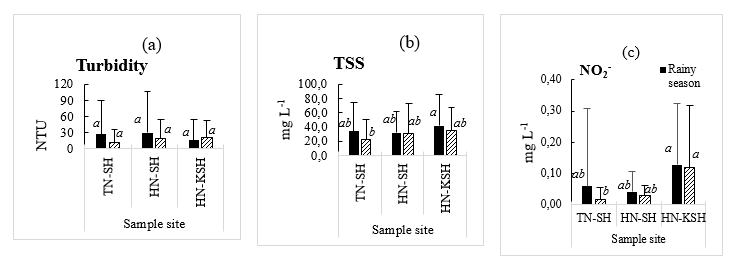
Figure 3 . Seasonal variation ofwater quality parameters in factor 2 (a, b), including Turbidity, TSS, NO 2 - . (Note: Error bars indicate the standard deviation of the mean.Within the insets, bars with different letters are significantly different from each other (p <0,05)).
Source: Author
Among the three water quality parameters presented in Figure 3 , turbidity, total suspended solids (TSS), and nitrite (NO₂⁻) were significantly affected by the interaction between spatial zones and seasonal variation. In the rainy season, upstream rivers had a greater turbidity value than downstream. Conversely, the turbidity value of upstreams was lower than downstream in the rainy season ( Figure 3 a). Soil erosion, which carries surface materials, sediments, and suspended solids into surface water, increases the turbidity concentration 49 , 50 . The TSS concentration had a similar tendency to turbidity fluctuation ( Figure 3 b). Domestic wastewater 32 and aquaculture wastewater 31 , 42 attributed to the rise of this parameter in HN-KSH and HN-SH zones and TN-SH, respectively. Similarly, the rainy season had a higher NO 2 - than the dry season ( Figure 3 c) in 3 zones. This could be linked to the nitrification process, where ammonium is transformed into nitrite 51 . The rise of the magnitude of NO 2 - concentration in HN-KSH, TN-SH, and HN-SH areas was observed in both the rainy and dry seasons ( Figure 3 c). This increase is likely attributed to the transport of pollutants from the upstream areas toward the downstream sections of the river basin 52 .
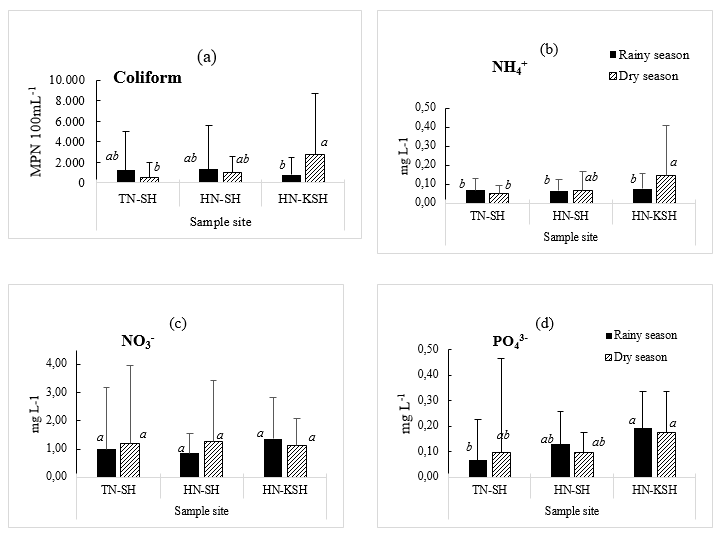
Figure 4 . Seasonal variation of waterquality parameters in factor 3 (a, b), including: Coliform, NH 4 + and water quality parameters in factor 4 (c, d)including: NO 3 - , PO 4 3- . (Note: Errorbars indicate the standard deviation of the mean. Within the insets, bars withthe same letter are not significantly different from each other).
Source: Author
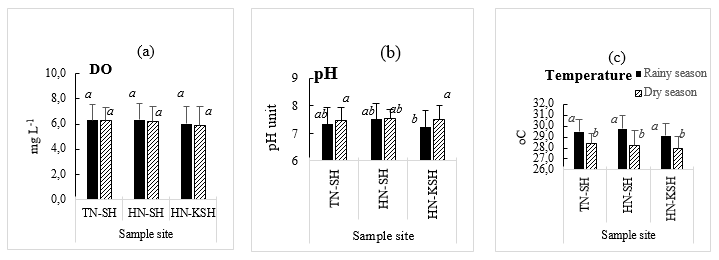
Figure 5 . Seasonal variation of water quality parameters in factor 5 (a, b, c),including:DO, pH, T o C. (Note: Error bars indicate thestandard deviation of the mean. Within the insets, bars with the same letterare not significantly different from each other).
Source: Author
Coliform density, which showed a strong association with factor 3, was markedly elevated in the rainy season relative to the dry season within the TN-SH and HN-SH regions ( Figure 4 a). Precipitation which carried pollutants, such as surface materials, sediments, suspended solids, wastewater, fertilizers, and bacteria into water, was the main reason 48 . Meanwhile, coliform levels in the HN-KSH area are lower during the rainy season than during the dry season. This may be due to the high slope of the river, helping to push pollutants being diluted into rainwater and floodwaters quickly flowing towards the river's mouth.
Figure 4 b-d and 5a showed the spatiotemporal variation of NH 4 + , NO 3 - , PO 4 3- and DO concentrations. Agricultural, forestry, aquaculture, and residential activities, accounted for the change of these parameters. Wastewater from agricultural areas or residential sources can release a significant amount of phosphate (P) into the environment 53 . Surface runoff from fields can wash away residual fertilizers (nitrogen, phosphorus, organic matter), as well as other water pollutants, into surface water 30 , 54 , 55 . This causes an increase in NH 4 + and NO 3 - , phosphate (P), nutrients, and organic matter in water bodies and oxygen consumption. Consequently, DO amounts in water reduced, eutrophication happened, and toxic algae grew up. The presence of high NH 4 + and NO 3 - levels contributes to decreased dissolved oxygen (DO) levels by increasing biological (microorganisms and algae) oxidation process 56 , 57 , 58 . The addition of nitrogen content in surface water can come from various sources, including atmospheric deposition, pollutants carried by rainfall, agricultural wastewater runoff, municipal wastewater, and industrial effluents 59 , 60 , but it is often most abundant from surplus food in aquaculture activities 31 .
In the TN-SH area, the rainy season showed a greater NH 4 + concentration than the dry season ( Figure 4 b). The reason may be the erosive washing away of various pollutants, including excessive inorganic and organic fertilizers, into the water 48 . Conversely, in the HN-SH and HN-KSH areas, the reduction in NH 4 + levels during the rainy season in comparison to the dry season can be explained by the dilution of pollutants by rainwater.
The NO 3 - the season factor influenced concentration in 2 zones (TN-SH, HN-SH) (Fig 4c). It found that the value of NO 3 - in rainy season was lower than in the dry season. This decrease could be attributed to the dilution of pollutants by rain. In contrast, an increase in NO 3 - levels in the HN-KSH area during the rainy season compared to the dry season was likely due to the pushing pollutants towards the river mouth during the rainy season 46 , 47 . Regarding the PO 4 3- parameter (Fig 4d), the rainy season showed a lower PO 4 3- concentration than the dry season in the TN-SH area, which can also be explained by the dilution of contaminants by rainwater. Conversely, a greater PO 4 3- concentration during the rainy season was found in both the HN-SH and HN-KSH areas. Accumulation of contaminants at the river's mouth during the flooding generated this issue.
For the DO parameter ( Figure 5 a), the DO concentration was not influenced by the season, but it gradually decreased from the upstream to the downstream area. As mentioned, this decrease is due to higher pollution levels (organic matter and nutrients) in the downstream areas 46 , 47 . Moreover, the pH parameter decreased from the upstream to the downstream areas during the rainy season ( Figure 5 b). This value during the dry season was higher in all three areas. For TN-SH, HN-SH area, rainwater washing surface materials, sediments, and suspended solids into the river were the main reasons for a reduction in pH levels in the water 49 , 50 . However, in the HN-KSH area, seawater intrusion increased chloride ion concentrations and pH during the dry season ( Figure 5 b). As Figure 5c, in TN-SH, HN-SH, and HN-KSH areas, a higher temperature in the rainy season than in the dry season was found. This can be explained by the solar energy absorption of suspended solids in the water source 45 . It is evident that during the rainy season, the TSS in surface water showed a significant increase compared to the dry season in all three research areas ( Figure 3 b).
Water quality index (WQI)
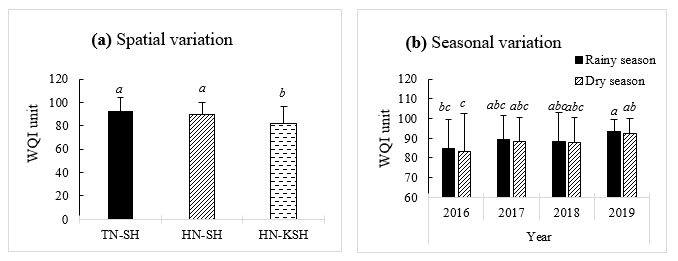
A declining trend in the Water Quality Index (WQI) was observed from upstream to downstream areas in Figure 6 a. Additionally, from 2016 to 2019, the WQI in the rainy season was slightly higher than the dry season ( Figure 6 b).
Figure 6 . Spatialand seasonalvariation of water quality index(WQIs) in Binh Thuan.
Source: Author
Pollutant accumulation contaminating the estuaries may reduce the WQI in the downstream area. Previous studies about Cau River 47 and Sai Gon River 46 proposed a similar tendency of WQI decrease. The transport of pollutants from the upstream to the downstream areas has been found in various studies about river basins 52 , 61 , and 62 .
From 2016-2019, WQI was lightly influenced by seasonal variation (WQI in the rainy season is higher than in the dry season). Precipitation diluted the pollutants in water, thus helping to increase the WQI value.
Conclusions
During the period from 2016 to 2019, surface water quality in Binh Thuan Province tends to be contaminated by TSS, BOD5, COD, NO2-, Cl-, and Coliform at varying levels. Statistical analyses (PCA, FA and ANOVA) indicated that surface water quality is potentially influenced by human activities (domestic use, agriculture, aquaculture and industry) as well as natural factors (saltwater intrusion, rainfall, erosion and prolonged heat). There was a spatiotemporal fluctuation of surface water quality in Binh Thuan province. Controlling seawater intrusion during the dry season and minimizing artificial pollution sources helps protect the province's surface water resources, serving the sustainable development of Binh Thuan province.
Acknowledgements
The author thanks the Department of Natural Resources and Environment of Binh Thuan province for supporting this research.
Competing Interests
The authors declare that they have no conflict of interest.
Authors' Contributions
Le Viet Thang: Conceptualization, data analysis, writing-original draft, writing-review and editing, submission.
References
- B. T. Nguyen, L. B. Le, A. H. Le, and N. V. Thai, "The interactive effects of the seawater intrusion-affected zones and types of waterways on the surface water quality from the coastal Tien Giang Province, Vietnam," Environmental Monitoring and Assessment, vol. 193, no. 4, p. 224, 2021. . ;:. Google Scholar
- Mateo-Sagasta J., Zadeh S.M., Turral H.. More people, more food, worse water?: a global review of water pollution from agriculture. . 2018;:. Google Scholar
- W. Bank. Water in agriculture. [Accessed April 2022]. . ;:. Google Scholar
- Okello C., Tomasello B., Greggio N., Wambiji N., Antonellini M.J.W.. Impact of population growth and climate change on the freshwater resources of Lamu Island, Kenya. . 2015;7(3):1264-1290. Google Scholar
- Lin L., Yang H., Xu X.J.F.. Effects of water pollution on human health and disease heterogeneity: a review. . 2022;10:880246. Google Scholar
- Sasakova N.. Pollution of surface and ground water by sources related to agricultural activities. . 2018;2:42. Google Scholar
- Akhtar M.S., Memon M.J.P.J. B.. Biomass and nutrient uptake by rice and wheat: a three-way interaction of potassium, ammonium and soil type. . 2009;41(6):2965-2974. Google Scholar
- Wilbers G.-J., Becker M., Sebesvari Z., Renaud F.G.J.S.. Spatial and temporal variability of surface water pollution in the Mekong Delta, Vietnam. . 2014;485:653-665. Google Scholar
- Karbassi A., Monavari S., Bidhendi G.R.Nabi, Nouri J., Nematpour K.J.E., assessment undefined. Metal pollution assessment of sediment and water in the Shur River. . 2008;147:107-116. Google Scholar
- Al-Hussaini S.N.H., Al-Obaidy A.H.M.J., Al-Mashhady A.A.M.J.. Environmental assessment of heavy metal pollution of Diyala River within Baghdad City. . 2018;8(3):87. Google Scholar
- Mutea F.G., Nelson H.K., Au H.V., Huynh T.G., Vu U.N.J.W.. Assessment of water quality for aquaculture in Hau River, Mekong Delta, Vietnam using multivariate statistical analysis. . 2021;13(22):3307. Google Scholar
- Poonam T., Tanushree B., Sukalyan C.J.I.J.. Water quality indices-important tools for water quality assessment: a review. . 2013;1(1):15-28. Google Scholar
- Vega M., Pardo R., Barrado E., Debán L.J.W.. Assessment of seasonal and polluting effects on the quality of river water by exploratory data analysis. . 1998;32(12):3581-3592. Google Scholar
- Shrestha S., Kazama F.J.E., software undefined. Assessment of surface water quality using multivariate statistical techniques: A case study of the Fuji river basin, Japan. . 2007;22(4):464-475. Google Scholar
- Oketola A.A., Adekolurejo S.M., Osibanjo O.. Water quality assessment of River Ogun using multivariate statistical techniques. . 2013;:. Google Scholar
- Phung D.. Temporal and spatial assessment of river surface water quality using multivariate statistical techniques: a study in Can Tho City, a Mekong Delta area, Vietnam. . 2015;187:1-13. Google Scholar
- Nguyen B.T., Vo L.D., Nguyen T.X., Quang N.X.J.W.R.. The interactive effects of natural factor and pollution source on surface water quality in the Lower Mekong River Basin, Southwestern Vietnam. . 2020;47(5):865-876. Google Scholar
- Ibrahim T., Othman F., Mahmood N.Z., Abunama T.J.S.M.. Seasonal effects on spatial variations of surface water quality in a tropical river receiving anthropogenic influences. . 2021;50(3):571-593. Google Scholar
- Yang S., Liang M., Qin Z., Qian Y., Li M., Cao Y.J.S.. A novel assessment considering spatial and temporal variations of water quality to identify pollution sources in urban rivers. . 2021;11(1):8714. Google Scholar
- Le T.V., Do D.D., Nguyen B.T.J.H.. Spatiotemporal assessment and pollution-source identification and quantification of the surface water system in a coastal region of Vietnam. . 2023;68(6):782-793. Google Scholar
- Le T.V., Nguyen D.T.P., Nguyen B.T.J.E.M.. Spatial and temporal analysis and quantification of pollution sources of the surface water quality in a coastal province in Vietnam. . 2023;195(3):408. Google Scholar
- Sở Tài nguyên và Môi trường tỉnh Bình Thuận, Báo cáo hiện trạng môi trường 05 năm (2016-2020) của tỉnh Bình Thuận. Tỉnh Bình Thuận, 2020. . ;:. Google Scholar
- Bộ Tài nguyên và Môi trường, QCVN 08:2023/BTNMT – Quy chuẩn kỹ thuật quốc gia về chất lượng nước mặt. Thành phố Hà Nội, 2023. . ;:. Google Scholar
- Prathumratana L., Sthiannopkao S., Kim K.W.J.E.. The relationship of climatic and hydrological parameters to surface water quality in the lower Mekong River. . 2008;34(6):860-866. Google Scholar
- Heale R., Twycross A.J.E.-b. Validity and reliability in quantitative studies. . 2015;18(3):66-67. Google Scholar
- Feher I.-C., Moldovan Z., Oprean I.J.W.S.. Spatial and seasonal variation of organic pollutants in surface water using multivariate statistical techniques. . 2016;74(7):1726-1735. Google Scholar
- Ott R., Longnecker M.. An introduction to statistical methods and data analysis. . 2010;:. Google Scholar
- Huang M.-h, Li Y.-m, Gu G.-w J.D.. Chemical composition of organic matters in domestic wastewater. . 2010;262(1-3):36-42. Google Scholar
- Hamed M.A.R.. Withdrawn: application of surface water quality classification models using principal components analysis and cluster analysis. . 2019;:. Google Scholar
- Li S.. Effect of different organic fertilizers application on soil organic matter properties. . 2017;25(sup1):S31--S36. Google Scholar
- Dauda A.B., Ajadi A., Tola-Fabunmi A.S., Akinwole A.O.J.A., Fisheries Waste production in aquaculture: Sources, components and managements in different culture systems. . 2019;4(3):81-88. Google Scholar
- Economopoulos A.P., Organization U.World Health. Prevention of Environmental Pollution, "Assessment of sources of air, water, and land pollution : a guide to rapid source inventory techniques and their use in formulating environmental control strategies / by Alexander P. . 1993;:. Google Scholar
- Herbert E.R.. A global perspective on wetland salinization: ecological consequences of a growing threat to freshwater wetlands. . 2015;6(10):1-43. Google Scholar
- Alfarrah N., Walraevens K.J.W.. Groundwater overexploitation and seawater intrusion in coastal areas of arid and semi-arid regions. . 2018;10(2):143. Google Scholar
- Pham Q.-N., Nguyen N.-H., Ta T.-T., Tran T.-L.J.S.. Vietnam’s water resources: Current status, challenges, and security perspective. . 2023;15(8):6441. Google Scholar
- Minderhoud P., Coumou L., Erkens G., Middelkoop H., Stouthamer E.J.N.. Mekong delta much lower than previously assumed in sea-level rise impact assessments. . 2019;10(1):3847. Google Scholar
- Nguyên N.X., Hạ T.Đ.. Chất lượng nước sông hồ và bảo vệ môi trường nước. . 2024;:. Google Scholar
- SHRESTHA S., KAZAMA F.J.P. H. E.. Multivariate statistical techniques for the assessment of surface water quality of Fuji River Basin, Japan. . 2006;50:13-18. Google Scholar
- Qadir A., Malik R.N., Husain S.Z.J.E.. Spatio-temporal variations in water quality of Nullah Aik-tributary of the river Chenab, Pakistan. . 2008;140:43-59. Google Scholar
- Coldebella A., Gentelini A.L., Piana P.A., Coldebella P.F., Boscolo W.R., Feiden A.J.S.. Effluents from fish farming ponds: A view from the perspective of its main components. . 2017;10(1):3. Google Scholar
- Cooper C.J.J.. Biological effects of agriculturally derived surface water pollutants on aquatic systems—a review. . 1993;22(3):402-408. Google Scholar
- Kok D.-J.D.. Global phosphorus recovery from wastewater for agricultural reuse. . 2018;22(11):5781-5799. Google Scholar
- Matta G., Nayak A., Kumar A., Kumar P.J.A.W.S.. Water quality assessment using NSFWQI, OIP and multivariate techniques of Ganga River system, Uttarakhand, India. . 2020;10(9):206. Google Scholar
- Wehrheim C., Lübken M., Stolpe H., Wichern M.J.W.. Identifying key influences on surface water quality in freshwater areas of the Vietnamese Mekong Delta from 2018 to 2020. . 2023;15(7):1295. Google Scholar
- Venkatramanan S., Chung S.Y., Lee S.Y., Park N.J.C.J. E., Sciences E.. Assessment of river water quality via environmentric multivariate statistical tools and water quality index: a case study of Nakdong River Basin, Korea. . 2014;9(2):125-132. Google Scholar
- Nguyen T., Ha N., Sthiannopkao S.J.J. S., Technology undefined. Risk assessment of the Sai Gon river water quality for safety water supply to Ho Chi Minh city. . 2011;9:1-10. Google Scholar
- Son C.T.. Assessment of Cau River water quality assessment using a combination of water quality and pollution indices. . 2020;69(2):160-172. Google Scholar
- Maprasit S., Darnsawasdi R., Rangpan V., Suksaroj C.J.G.J.. Spatial variations of surface water quality and pollution sources in Khlong U-Tapao river basin. . 2018;14(43):98-103. Google Scholar
- Xiao L., Zhang Q., Niu C., Wang H.J.I.J. E. R., Health P.. Spatiotemporal patterns in river water quality and pollution source apportionment in the arid Beichuan River basin of northwestern China using positive matrix factorization receptor modeling techniques. . 2020;17(14):5015. Google Scholar
- Ofosu S.A., Adjei K.A., Odai S.N.J.A.W.S.. Assessment of the quality of the Densu river using multicriterial analysis and water quality index. . 2021;11(12):183. Google Scholar
- Muangthong S., Shrestha S.J.E., assessment undefined. Assessment of surface water quality using multivariate statistical techniques: case study of the Nampong River and Songkhram River, Thailand. . 2015;187:1-12. Google Scholar
- Briciu A.-E., Graur A., Oprea D.I.J.W.. Water quality index of suceava river in Suceava city metropolitan area. . 2020;12(8):2111. Google Scholar
- Bowes M.. Characterising phosphorus and nitrate inputs to a rural river using high-frequency concentration–flow relationships. . 2015;511:608-620. Google Scholar
- Carpenter S.R., Caraco N.F., Correll D.L., Howarth R.W., Sharpley A.N., Smith V.H.J.E.. Nonpoint pollution of surface waters with phosphorus and nitrogen. . 1998;8(3):559-568. Google Scholar
- Bertol O.J., Rizzi N.E., Favaretto N., Lana M. C. J. S. A.. Phosphorus loss by surface runoff in no-till system under mineral and organic fertilization. . 2010;67:71-77. Google Scholar
- Fernandes L. Almeida. Effect of temperature on microbial diversity and nitrogen removal performance of an anammox reactor treating anaerobically pretreated municipal wastewater. . 2018;258:208-219. Google Scholar
- Xia X.. The cycle of nitrogen in river systems: sources, transformation, and flux. . 2018;20(6):863-891. Google Scholar
- Hong P.. Denitrification characterization of dissolved oxygen microprofiles in lake surface sediment through analyzing abundance, expression, community composition and enzymatic activities of denitrifier functional genes. . 2019;9:1-10. Google Scholar
- Noukeu N.. Characterization of effluent from food processing industries and stillage treatment trial with Eichhornia crassipes (Mart.) and Panicum maximum (Jacq. . 2016;16:1-18. Google Scholar
- Xue Y., Song J., Zhang Y., Kong F., Wen M., Zhang G.J.W.. Nitrate pollution and preliminary source identification of surface water in a Semi-Arid River Basin, using isotopic and hydrochemical approaches. . 2016;8(8):328. Google Scholar
- Babić G., Vuković M., Voza D., Takić L., Mladenović-Ranisavljević I.J.P.J. E. S.. Assessing Surface Water Quality in the Serbian Part of the Tisa River Basin. . 2019;28(6):. Google Scholar
- Fathi E., Zamani-Ahmadmahmoodi R., Zare-Bidaki R.J.A.W.S.. Water quality evaluation using water quality index and multivariate methods, Beheshtabad River, Iran. . 2018;8(7):210. Google Scholar


Note: TN-SH (blue markers) represents the upstream of thedomestic water supply with 12 sampling sites; HN-SH (purple markers) representsthe downstream of the domestic water supply with 4 sampling sites, and HN-KSH (red markers) represents thedownstream of other surface water system, comprising 8 sampling sites.
Source: Author