
 Open Access
 Abstract
In order to better evaluate the applicability of the inverse analysis method for calculation and evaluation of hydraulic properties of unsaturated soil in more realistic conditions, a transient one – step outflow experiment for layered sands was applied in the desaturation process with the purpose to attain the profiles of suction, saturation and flow rate with time. In this study, the fine sand and medium sand were used with the same thickness of 40cm for each layer. The sand grains were mixed under water and scooped into the plexiglas column (H = 80cm, D = 28cm, wall thickness = 1cm) to prepare a fully saturated sample. For homogeneity within each sand layer, the density of two sands must be controlled during soil column construction. For numerical study, the inverse simulation and one straightforward calculation were carried out to determine the unsaturated hydraulic properties of sands. Unsaturated hydraulic parameters in the van Genuchten model were estimated using soil suction measurements at 10cm intervals and an outflow rate at the bottom of a layered sand column. To reduce the quantity of data for analysis and simulation but still keep enough typical information for the experiment, four data sets of soil suction and saturation at four locations (L2, L4, L5 and L8) were selected out of eight to compile the Soil Water Characteristic Curve. The comparison between predicted unsaturated hydraulic properties and the experimental unsaturated hydraulic properties shows good agreement in the case of the fine sand was overlaid with medium sand. The results concluded that besides the homogeneous sand, the inverse analysis based on the 1-D outflow experiment promises to be a useful method in determining the hydraulic properties for unsaturated heterogeneous sand.
INTRODUCTION
The unsaturated hydraulic properties of soils are very important in providing the essential knowledge for solving many engineering problems in the geo-engineering such as seepage, slope stability, bearing capacity, consolidation and settlement, water contamination, etc. The most traditional determinations of unsaturated soil hydraulic properties require relatively restrictive initial conditions and boundary conditions, and thus can be time-consuming, laborious, expensive and uncertainty for most practical applications 1 . To simplify and reduce the calculations of unsaturated hydraulic functions for soils, in general cases, the soils can be assumed as homogeneous soils. However, almost field soils are inherently heterogeneous, and idealized conditions of homogeneity are rarely encountered in nature (not to say that homogeneity in all aspects never occurs, in reality), even soils carefully prepared in a laboratory are not perfect homogeneity. Therefore, the values of hydraulic properties of unsaturated heterogeneous soils in many cases are more appropriate for solving many engineering problems. Accordingly, finding out a good method to determine accurately the hydraulic properties of unsaturated layered soils with the real conditions are not easy but necessary.
The determination of hydraulic conductivity for unsaturated homogeneous soils is an inherently complicated problem, so the determination of hydraulic conductivity for unsaturated heterogeneous soils is obviously more and more complex problem. Nowadays, two common approaches are usually used to determine and describe the unsaturated hydraulic properties in heterogeneous soils 2 , 3 .
The first approach assumes the heterogeneous system is replaced by an equivalent (effective) homogeneous media. In this case, the unsaturated hydraulic properties for equivalent homogeneous soil can be calculated by using the indirect methods developed for homogeneous media such as pedotransfer functions 4 , used texture for calculating hydraulic properties; Scaling techniques 5 , given the reasonable scale for formulated model to describe the movement of water in unsaturated soils; Multimodal water retention curves 6 , developed a modified water retention model to describe the water retention curve (WRC) of soils with multimodal pore systems; Inverse analysis 7 , 8 , 9 , 10 , used numerical method with input data from experiment to estimate the unsaturated hydraulic properties; and Averaging method 11 , proposed the averaging schemes for computing hydraulic conductivity between two adjacent nodes of the computational grid. Due to soil heterogeneity, the hydraulic properties do not remain uniform and models based on this assumption give poor results 12 .
The second approach estimates the hydraulic properties of the specific layer in unsaturated heterogeneous soils to establish a detailed deterministic model. In this way, the soil within layers is assumed homogeneous soil. In other words, although there are the variances of suction, saturation, void ratio, etc., in a layer, the heterogeneity within layers is ignored. There are some researches had been used to determine the unsaturated hydraulic properties following the second approach, such as: Laboratory study 13 , analyzed unsaturated flow of water moving steadily through an isothermal two-layer soil using Darcy's equation Fixed Gradient Models 14 , used to model drainage from unsaturated layered soils Numerical analysis 15 , developed an useful algorithm to estimate the interlayer hydraulic conductivity for unsaturated layered soils; Multiphase flow experiments and image analysis technique 16 , conducted to investigate the effect of textural interfaces on water pressure and nonaqueous phase liquid pressure and estimate the saturation distribution during infiltration and drainage. This approach was applied to nearer real conditions than the first approach. However, to find a faster, more accurate and more realistic calculation method is always the aim of the researchers.
In this study, the second approach was applied combined with inverse analysis. In order to apply this approach, the hydraulic parameters for the specific soil layer must be determined. In a layered medium, the number of parameters increases proportionally with the number of layers and require too much data and computational effort 17 . Recently, ecause of major advances in computational techniques and computer power, the possible technique for obtaining these effective values is to conduct an inverse method, e.g., by minimizing the differences between the values predicted by the homogeneous equation and observed values. The successful application of the inverse modeling technique for determining the unsaturated soil properties improves both speed and accuracy, and promise to be the dominated technique for solving the problems in geotechnical engineering particularly, engineering and physical sciences generally.
The previous research had focused on the applicability of the inverse analysis method for determination of unsaturated soil hydraulic properties of flow through homogeneous porous media using one-dimension outflow experiment 18 . For the further research, the objectives of this study are: to evaluate the applicability of an inverse analysis for estimating the hydraulic properties for unsaturated layered sands from 1-D outflow experiment; to consider the performance of independent forward simulation using existing hydraulic parameters of two types of sand obtained from the previous experiments for a single layer system.
MATERIALS AND METHODS
Materials
In this study, the laboratory experiment of vertical drain for layered sand column, which consisted of two sands, was described. Two sands used for the experiments in this chapter were medium sand and fine sand. The properties of two sands are shown in Table 1 .
The properties shown in Table 1 reveal that two sands are classified as poor grade sand (C u < 6 and C c < 1 or C c > 3; ASTM D-2487). In other words, the sands used in the present study are very uniform.
The SWCC references of two sands obtained from independent experiments for column sand in 1-D outflow condition, one from the previous study for medium sand 18 , another from the similar experiment for fine sand, are shown in Figure 1 . In which, the hydraulic parameters of medium sand and fine sand are P 0m = 1.29 and m = 0.882; P 0f = 3.32 and f = 0.889, respectively.
Figure 1 . The drying SWCC of medium sand and fine sand determined from independent experiments.

Experimental method
The same Plexiglas column in previous research was also used to conduct drainage test and was attached with eight tensiometers and eight electrical resistivity probes (ERP) along the sample ( Figure 2 a and Figure 2 b). The base of column overlaid on fine mesh with the mesh size number of 200. This mesh rested on an acrylic plate with honeycomb shape of 8mm circular holes. A tipping bucket funnel was placed right beneath the acrylic plate and connected to the burette, which can change the water table in the soil column by change the free outflow level of water in the burette 18 , 19 .
To easily pack and unpack soil column, the Plexiglas column was separated into individual sections. These sections can be connected to each other using screws with an O-ring seal placed within a groove in the base of every section to prevent water from leaking out between sections. Eight sampling ports having the same elevation and diameter with tensiometer and ERP ports were made along the height of the soil column. At the end of the experiment, the small samples of sands can be extracted through these sampling ports easily and used for gravimetric water content analysis to make sure that the water content (degree of saturation) values get from ERPs is reliable.
Figure 2 . (A) The schematic diagram of column test; (B) The laboratory test for layered system

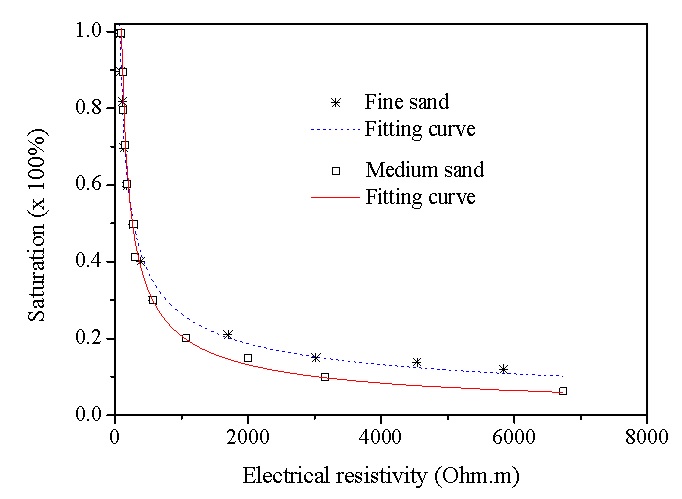
The degree of saturation of soil at different locations in soil column and different times during draining test was calculated by using calibration curves, which were built with exponents were fitted using Archie’s law (Equation 1) 20 . As the results of independent experiments, the fitting exponents of calibration curves for medium sand and fine sand are m m = 1.32, n am = 1.57 and m f = 1.68, n af = 1.93, respectively ( Figure 3 ).
where S w is degree of saturation, m and n a are the Archie exponent, n is the porosity of soil, is soil resistivity, and w is resistivity of water.
Figure 3 . Calibration relationship between electrical resistivity and saturation for: solid-line for medium sand; dash-line for fine sand.
The sand grains were slurry packed (filling the column with water and then slowly pouring or sprinkling dry sand into the column) into the column to prepare a fully saturated sample 21 . The density of two sands must be controlled during soil column construction. The temperature in the laboratory was maintained at 20 0 C to prevent a change in water-air surface tension 22 .
In the study, only one-step outflow experiment was conducted for the experiment. Therefore, in the experiment, outflow was maintained at the bottom level of the column during the test. Time intervals for measuring the soil suction, soil resistivity and cumulative outflow were around 10s, which make sure that the quick change of soil suction, soil resistivity and outflow rate can be recorded with an equal temporal resolution 1 .
Numerical method
The inverse analysis consists of the identification of parameters in models for these coefficients. The inverse calculation was carried out using two computer models, one for forward flow modeling and the other for nonlinear optimization.
Forward modeling
The one-dimension water balance equation, well-known Richards' equation, was used to describe the 1-D water flow in the soil sample:
where , is the porosity of the soil, S l is saturation of liquid water, is mass of water per unit volume in the liquid phases, is the liquid flow flux in liquid phase, k is the hydraulic conductivity, h is the pressure head, and z is the depth which is positive upward from the sample bottom.
The soil water retention curve and unsaturated hydraulic conductivity function can be described by various expressions. However, with the good results in determination of unsaturated hydraulic properties for the homogeneous sand column were shown in the previous study, for convenience, the parametric form of van Genuchten model (1980) is applied again to describe the SWCC and unsaturated relative hydraulic conductivity for layered sands in this chapter 18 , 23 .
Nonlinear optimization
A non-linear optimization method used to minimize the objective function was L 2 error norm, which expresses the difference between observed and predicted data by using the least–square solution for the parameters in van Genuchten’s equation 18 , 24 .
In the inverse analysis, when many measurements are available, the system of equation can be expressed:
where are unknown soil properties, is the transformation matrix which is .
The error for the measurements is established between measured value (saturation, pressure head, outflow, displacements, stresses, etc.) and predicted value
Therefore, the objective function ( ) to be minimized becomes:
where is the initial guess of unknown variables, is the measurement data and is the weight factor (where W ij = weight value, W ij = 0 for i j).
In the optimization process, the minimization approach for the objective function and the sensitivity analysis are embedded into a multilevel algorithm. Minimization starts with the initial guess following van Genuchten parameters P 0 and . The values of initial guess parameters are repeatedly updated until a certain stopping criterion is satisfied, or the convergence criterion is achieved. At each step, the initial parameter values for the minimization are set by the result of the previous step to the new parameterization.
RESULTS
To reduce the quantity of data for analysis and simulation but still keep enough typical information for the experiment, the data at four locations of L2, L4, L5 and L8 was selected out of eight locations to perform, compile the SWCC and use as input data for simulation.
Experimental results
Similar to any previous one-step outflow experiments for grain soils under gravitational forces, the cumulative outflow and discharge rate also show rapid change during the short time after the beginning of testing because of the highest hydraulic gradient at initial testing. The cumulative outflow with time shows the steep slope during 50 min right after starting the test, and stopped flowing after 17 h with total outflow Q 15.4 cm ( Figure 4 a). The discharge rate reaches the highest value of 0.023 cm/s at some seconds after beginning of the experiment. The discharge rate decreases corresponding to hydraulic pressure and was nearly constant after 250 min ( Figure 4 b).
In the independent experiments for fine and medium sands, the deformations of sands resulting from a change in loading or consolidation occurred immediately and were relatively small. Therefore, in this study, the void ratio of sands can be considered constant when evaluating unsaturated hydraulic properties 18 , 25 .

Immediately, after opening the bottom valve to allow free drainage, the lower end of the fine sand column was exposed to atmospheric pressure, and soil is allowed to drain by gravity at that moment, hence the pore water pressure started to drop at every location in the sand column ( Figure 5 a). As shown in Figure 5 b, the distribution of pore water pressure for experiment was not hydrostatic at end of experiment ( t = 3.0 d).
Figure 5 . (A) Pore-water pressure with time at different heights in the sand column; (B) Pore-water pressure head profile in the sand column.

Water drainage of the saturated models was initiated at time t = 0. Figure 6 shows the vertical water saturation profiles measured by the ERP and calibration curve (Figure. 3). The saturation time series inferred from the four ERPs are shown in Figure. 6a. At the beginning of testing, the moisture content in the column was uniformly equal to 99%. The soil saturation at different locations started to decrease only after the pore water pressure at those locations reached to neighboring value of air-entry values or when the capillary fringe passes through the profile.
The data shown in Figure 5 a and Figure 6 a may be further interpreted using isochrones of pore water pressure and degree of saturation with height in the sand column, shown in Figure 5 b and Figure 6 b. The data in Figure 5 b and 6b show how the pore water pressure and degree of saturation gradually change vertically downward through the profile. Since bottom layer is fine sand, the capillary fringe laid higher than locations of L1, L2 and L3. Therefore, the sand at those locations remained saturated. The location L4 laid right above capillary saturation zone, thus soil there maintained a high degree of saturation during the tests, and all collected data were plotted near the saturation region. The water saturation at L5 and L8 became the constant value of 14 - 16% ( Figure 5 and Figure 6 ).
Figure 6 . (A) Water saturation with time obtained at different heights in sand column; (B) Water saturation profile with height in sand column.

Numerical results
According to the results in the previous research 18 , for convenience and to reduce the iteration step, the initial guess following van Genuchten parameters for medium sand and fine sand were: P 0m = 1.4 and m = 0.8 P 0f = 3.0 and f = 0.8, respectively. Two unknown parameters in the van Genuchten model, P 0 and , were determined by solving iteratively the general flow equation, updating the values of the parameters until the solution agrees with measured data. After 8 iterations, inversion results converged to P 0m = 1.61 and m = 0.92 for medium sand and fine sand, respectively.
Figure 7 show the evolution of discharge rate with time from the experimental observations and reproduced numerical results. The predicted value of discharge rate calculated using assessed hydraulic parameters produced a good agreement with experimental observations, although there exist differences right after beginning of testing ( Figure 7 ).

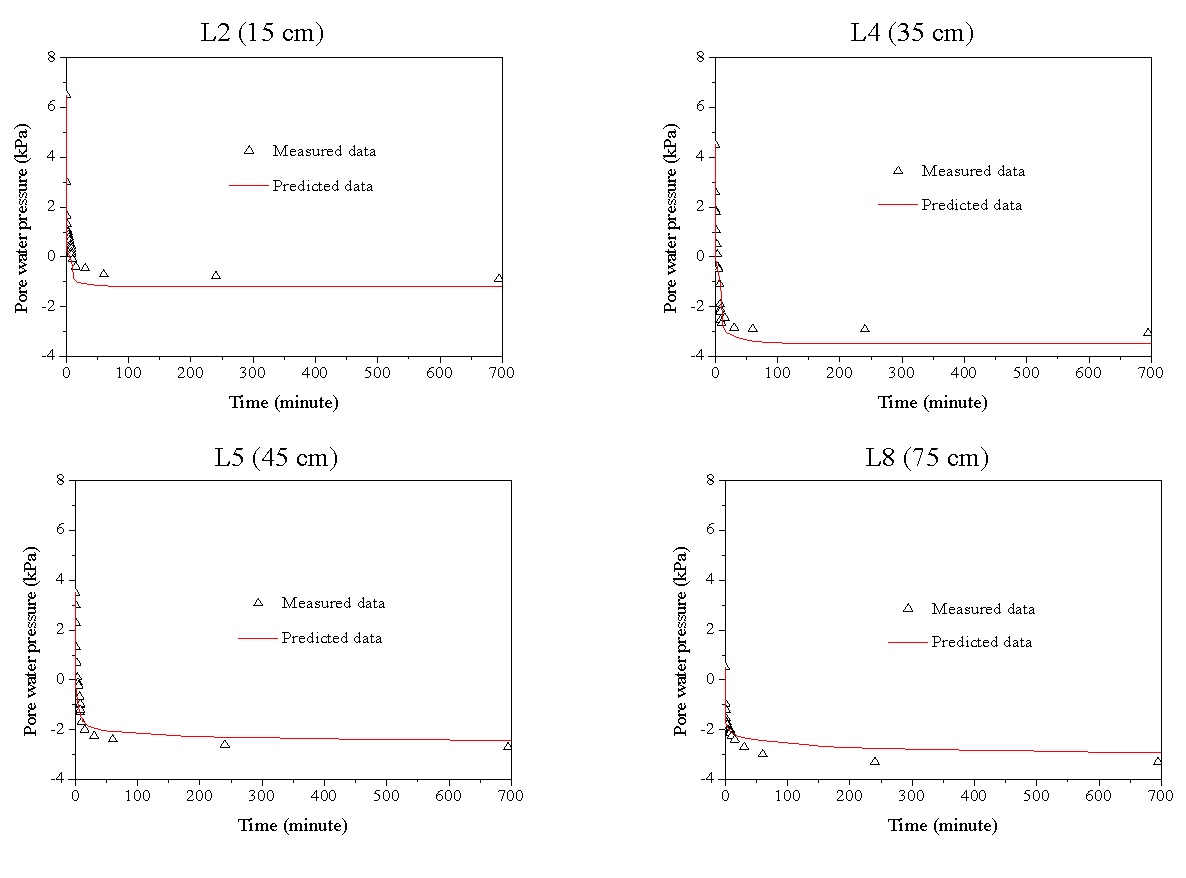
The comparison between predicted data and measured data of pore water pressure shows good agreement (RMSE = 0.006, Figure 8 ). This Figure indicates that at the location of L2 and L4, the predicted values of pore water pressure were higher than the measured values of pore water pressure only after around 10 – 20 min. However, at location of L5 and L8, the predicted values of pore water pressure taken long time (after 40 – 50 h) to be higher measured values of pore water pressure.
The Figure 9 a shows how good comparison between predicted data and measured data of soil saturation. The collective values with time at the same location of both soil saturation and pore-water pressure can be compiled into the SWCC ( Figure 9 ). The difference of pore system between the lower part and the upper part in soil column and dramatic changes of pore water pressure at bottom of soil column cause the hysteresis at L2, L4 and L5 ( Figure 9 ). However, because the upper part has higher hydraulic conductivity than the lower part, the hysteresis at L2, L4 and L5 is relative small. The water front rapidly dropped down at the beginning of testing, the lack of soil saturation data at some locations near the soil surface therefore can be happen, so using the multi-step outflow experiment can help cover the full range of the SWCC plot.
Figure 8 . Comparison between predicted and measured pore water pressure at location of L2, L4, L5 and L8.
The finite element and inverse analysis contain the sums of squared deviations between measured and simulated hydraulic properties. The comparison was conducted by computing the root mean square error (RMSE) from predicted and observed soil suction and soil saturation values using equation:
where represents experimental measurements, denotes predicted values using estimated soil properties such as pore-water pressure, degree of saturation and flow rate and N is total number of measurements.
The Table 2 shows the accuracy of the fitting in comparison between the measured values and modeled values. The hysteresis phenomenon and narrow range of saturation contributed to the error in the evaluation of hydraulic properties, which can be proved with high values of RMSE at L4 and L5 ( Table 2 , Figure 8 , Figure 9 a).
Figure 9 . Comparison between predicted and measured hydraulic properties at location of 2, 4, 5 and 8: (a) change in degree of saturation; (b) compiled SWCC.

CONCLUSIONS
Since the inverse analysis was becoming a useful tool to determine the unsaturated hydraulic conductivity for homogeneous soil profile, many problems in Geoscience related to the unsaturated hydraulic parameters for heterogeneous soil profiles also have been considered because of the high similar condition of these problems with real site condition. Although many attempt have been made to determine the soil hydraulic parameters for heterogeneous soil profiles using inverse analysis, there is not yet satisfied affirmation in comparison with measured hydraulic properties of unsaturated soils. For the present study, inverse analysis was applied to identify the unsaturated hydraulic function in the Richards’ equation and van Genuchten model using outflow rate and suction, which were obtained from one-step outflow experiment for the layered sand column, at specific depths over time. Subsequently, the SWCC data given from combining measured soil suction and degree of saturation were compared with model predictions.
The weight factor and initial guessed values do not significantly affect the final identified parameters. However, with reasonable weight and initial guessed values, the calculation time will be faster and the final identified parameters will be more reliable.
With the same initial guessed values as the previous study 18 , the computed values for the layered sands converge faster than the homogeneous sand (8 iterative steps in this study vs 10 iterative steps in the previous study). This reason can be explained by the small ranges of water saturation and suction used as input data is small in the fine sand layer.
Application of the inverse analysis method to determine the unsaturated hydraulic properties for layered sand column has shown good results in comparison with the measurements. Therefore, the inversion analysis of a 1-D de-saturation column test could be a good indirect method to evaluate hydraulic properties of unsaturated layered sands.
Overall, in spite of a small difference in the comparison between measured and predicted data of inverse analysis applied for soil profiles which have heterogeneous hydraulic properties, a further investigation should be extended with consideration of the high hysteresis and capillary barrier conditions in determining the unsaturated hydraulic properties of soils at both laboratory and in situ scale.
LIST OF ABBREVIATIONS
1-D: One – Dimension
SWCC: Soil-Water Characteristic Curve
ERP: Electrical Resistivity Probes
WRC: Water Retention Curve
COMPETING INTERESTS
The authors guarantee that there is no conflict of interest in the publication of the article “Using inverse analysis to Estimate Hydraulic Properties for Unsaturated Layered Sand”
CONTRIBUTION OF THE AUTHORS
To Viet Nam experiments, runs simulations, analyzes results and writes the manuscript
Nguyen Viet Ky: comments the results and the manuscript
ACKNOWLEDGEMENTS
This research was supported by the Research Fund of University of Ulsan, Korea.
References
- Hopmans J.W., Simunek J., Romano N., Durner W.. Simultaneous determination of water transmission and retention properties. Inverse Methods. IN: Methods of Soil Analysis. Part 4. Physical Methods. (J.H. Dane and G.C. Topp, Eds.). Soil Science Society of America Book Series. 2002;(5):963-1008. Google Scholar
- Yeh T.C.. A review of scale problem and applications of stochastic methods to determine groundwater travel time and path. Dep Of Hydrol. And Water Resources, University of Arizona, Tucson. 1989a;:199. Google Scholar
- Yeh T.C.J., Harvey D.J.. Effective unsaturated hydraulic conductivity of layered sands. Water Resources Research. 1990;26(6):1271-1279. Google Scholar
- Saxton K.E., Rawls W.J., Romberger J.S., Papendick R.I.. Estimating generalized soil water characteristics from texture. Trans. ASAE. 1986;50:1031-1035. Google Scholar
- Raats P.A.C.. On the roles of characteristic lengths and times in soil physical processes. 14th International Congress of Soil Science. 1990;1:. Google Scholar
- Durner W.. Predicting the unsaturated hydraulic conductivity using multi-porosity water retention curves. In M.Th. van Genuchten et al. (ed) Proceedings of the International Work-shop on Indirect Method for Estimation the Hydraulic Properties of Unsaturated Soils. University of California, Riverside. 1992;:185-202. Google Scholar
- Dam J.C., Stricker J.N.M., Droogers P.. Inverse Method for Determining Soil Hydraulic Functions from One‐Step Outflow Experiments. Soil Sci. Soc. Am. J. 1992;56:1042-1050. Google Scholar
- Simunek J., Genuchten M.T.. Estimating unsaturated soil hydraulic properties from tension disc infiltrometer data by numerical inversion. Water Resour. Res. 1996;32:2683-2696. Google Scholar
- Lehmann F., Ackerer Ph.. Determining Soil Hydraulic Properties by Inverse Method in One‐Dimensional Unsaturated Flow. Journal of environmental quality. 1997;26(1):76-81. Google Scholar
- Abbaspour K.C., Genuchten M.T., Schulin R., Schlappi E.. A sequential uncertainty domain inverse procedure for estimating subsurface flow and transport parameters. Water Resour. Res. 1997;33:1879-1892. Google Scholar
- Szymkiewicz A., Helmig R.. Comparison of conductivity averaging methods for one-dimensional unsaturated flow in layered soils. Advances in Water Resources. 2011;34(8):1012-1025. Google Scholar
- Singh M.P., Chauhan H.S., Ram S.. Unsteady state drainage in a vertically heterogeneous soil. Agricultural Water Management. 1996;31(3):285-293. Google Scholar
- Srinilta Steady flow of water through a two-layered soil. Water Resour. Res. 1969;(5):. Google Scholar
- Sisson J.B.. Drainage from layered field soils: Fixed gradient models. Water Resour. Res. 1987;23:2071-2075. Google Scholar
- Romano N, Brunone B, Santini A. Numerical analysis of one-dimensional unsaturated flow in layered soils. Adv Water Resour. 1996;21(4):315-324. Google Scholar
- Kechavarzi C., Soga K., Illangasekare T., Nikolopoulos P.. Laboratory study of immiscible contaminant flow in unsaturated layered sands. Vadose Zone Journal. 2008;7(1):1-9. Google Scholar
- Dam J.C., Feddes R.A.. Modelling of water flow and solute transport for irrigation and drainage. Sustainability of Irrigated Agriculture. 1996;:211-231. Google Scholar
- Nam T.V., T.K. Min, Shin H.S.. Using inverse analysis to estimate hydraulic properties of unsaturated sand from one-dimension outflow experiments. Engineering Geology. 2013;164:163-171. Google Scholar
- Sharma R.S., Mohamed M.H.A.. An experimental investigation of LNAPL migration in unsaturated/saturated sand. Engineering Geology. 2003;70:305-313. Google Scholar
- Archie G.E.. The electrical resistivity log as an aid in determining some reservoir characteristics. Petroleum Transactions of AIME. 1942;146:54-62. Google Scholar
- Lewis J.. Optimizing the experimental design of unsaturated soil columns. 19th World Congress of Soil Science, Soil Solutions for a Changing World. 2010;:. Google Scholar
- Kechavarzi C., Soga K.. Determination of Water Saturation Using Miniature Resistivity Probes During Intermediate Scale and Centrifuge Multiphase Flow Laboratory Experiments. Geotechnical testing journal, GTJODJ. 2002;25(1):95-103. Google Scholar
- Genuchten M.T.. A Closed-Form Equation for Predicting the Hydraulic Conductivity of Unsaturated Soils. Soil Science. Society. Am. J. 1980;44:892-898. Google Scholar
- Santamarina J.C., Fratta D.. Discrete Signals and Inverse Problems. Wiley, New York. 2005;:. Google Scholar
- Shin H., Santamarina J.C.. Desiccation cracks insaturated fine-grained soils: particle-level phenomena and effective-stress analysis. Géotechnique. 2011;61(11):961-972. Google Scholar


